Onboarding Sophos XDR Logs to Wazuh
On April 15, 2022
Introduction
On Wednesday, April 13, 2022, Sophos Intercept X offers unrivalled endpoint protection thanks to its robust extended detection and response (XDR) features. Threats can be hunted to detect active attackers, or they can be used in IT operations to keep security in check. Act immediately when an issue is identified remotely. Utilize rich data sources such as endpoint, server, firewall, and email to extend visibility beyond the endpoint. The addition of XDR, formerly known as Intercept X with EDR, extends Sophos’ already powerful endpoint security beyond the endpoint.
Wazuh, which contains a variety of visualizations and dashboards for effective monitoring and simpler correlation, allows us to keep track of Suspicious Events in one location. With the help of our custom rules, we can inspect the logs for any anomalies and take immediate action. Custom rules and decoders will be necessary toTo collect the logs and establish alerts on Wazuh for any anomalies so that notifications may be sent out
Wazuh configuration for Sophos XDR
fetch the logs via Syslog facility. Open the Wazuh Agent’s configuration:
vi /var/ossec/etc/ossec.conf
Add the following block:
<ossec_config>

  <localfile>

    <log_format>syslog</log_format>

    <location>/root/Sophos-Central-SIEM-Integration/log/result.txt</location>

  </localfile>

</ossec_config>
After the changes done in the configuration, the wazuh-agent’s service needs to be restarted.
For Systemd:
systemctl restart wazuh-agent
For SysV Init:
service wazuh-agent restart
Adding Rules in Wazuh
We’ll utilize the below rules in the local rules.xml files to let Wazuh understand Senhasegura’s logs and trigger alerts for any anomalies. Use the WUI or add the following decoders to the /var/ossec/etc/rules/local_rules.xml file.
<group name="Sophos">

  <rule id="100209" level="3">
     <decoded_as>json</decoded_as>
     <field name="type">Event::Endpoint::UpdateSuccess</field>
     <description>Sophos Agent Update</description>
  </rule>

  <rule id="100210" level="3">
     <decoded_as>json</decoded_as>
     <field name="type">Event::Endpoint::SavScanComplete</field>
     <description>Scan 'Sophos Cloud Scheduled Scan' completed</description>
  </rule>

  <rule id="100211" level="3">
     <decoded_as>json</decoded_as>
     <field name="type">Event::Endpoint::Threat::Detected</field>
     <description>Sophos Endpoint Threat Detected</description>
  </rule>

  <rule id="100212" level="3">
     <decoded_as>json</decoded_as>
     <field name="type">Event::Endpoint::Threat::CleanupFailed</field>
     <description>Sophos Endpoint Threat CleanUp Failed</description>
  </rule>

</group>
After the changes are done in the configuration, the wazuh-manager’s service needs to be restarted.
For Systemd:
systemctl restart wazuh-manager
For SysV Init:
service wazuh-manager restart
You can test the RAW logs to confirm if the decoders and rules are properly working or not in the Wazuh Logtest.
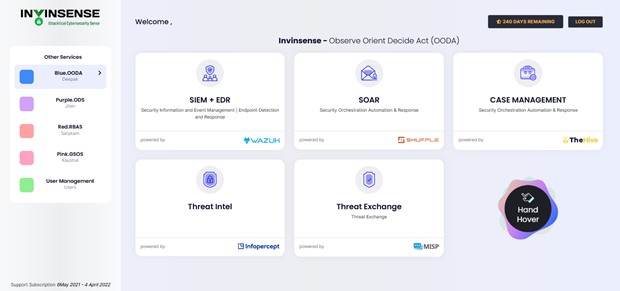
Login to your Invinsense Portal and open Wazuh.
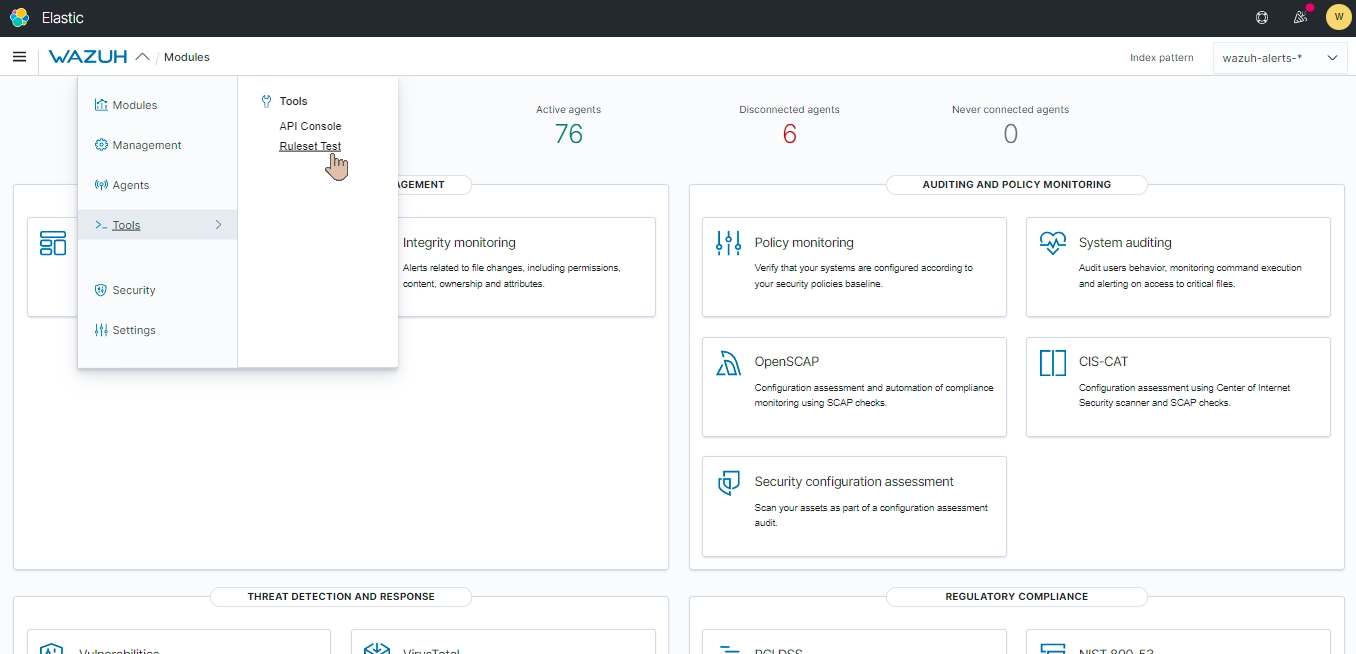
Go to Tools > Ruleset Test
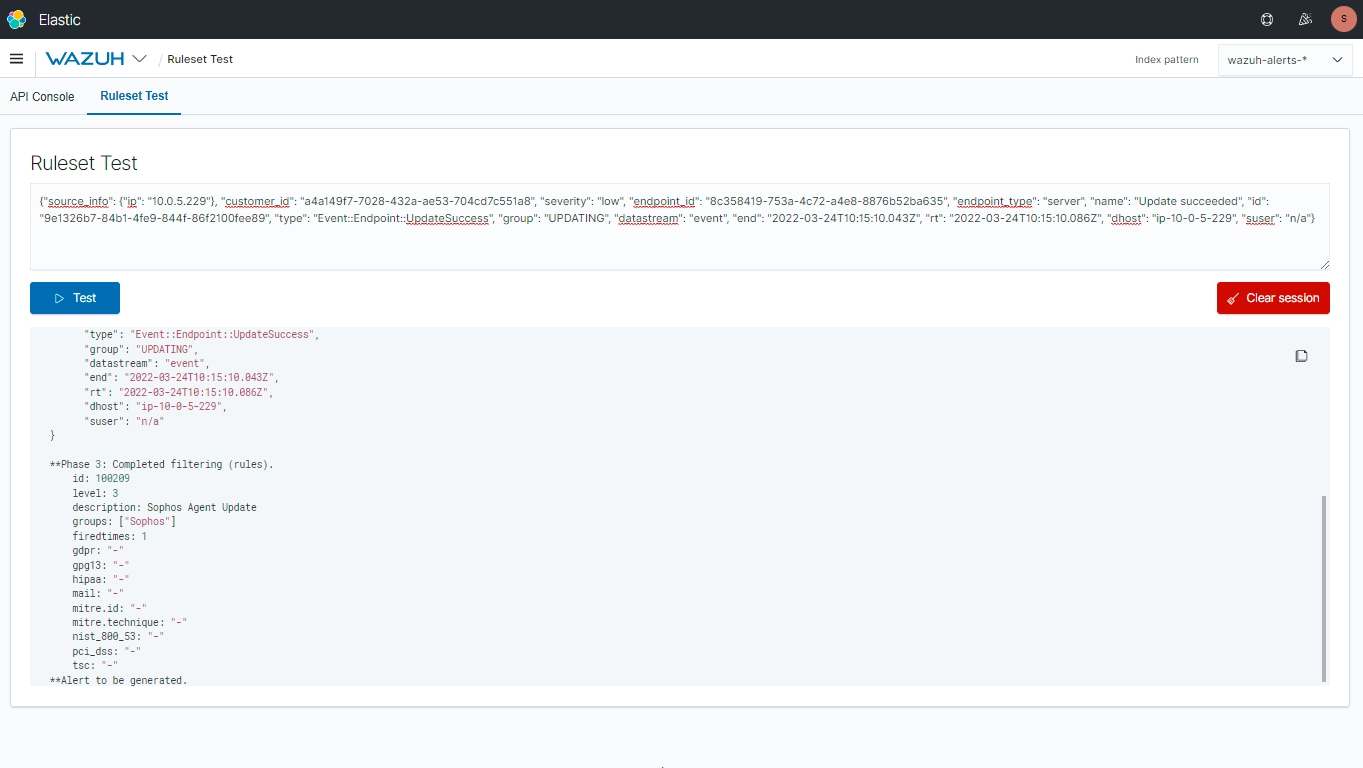
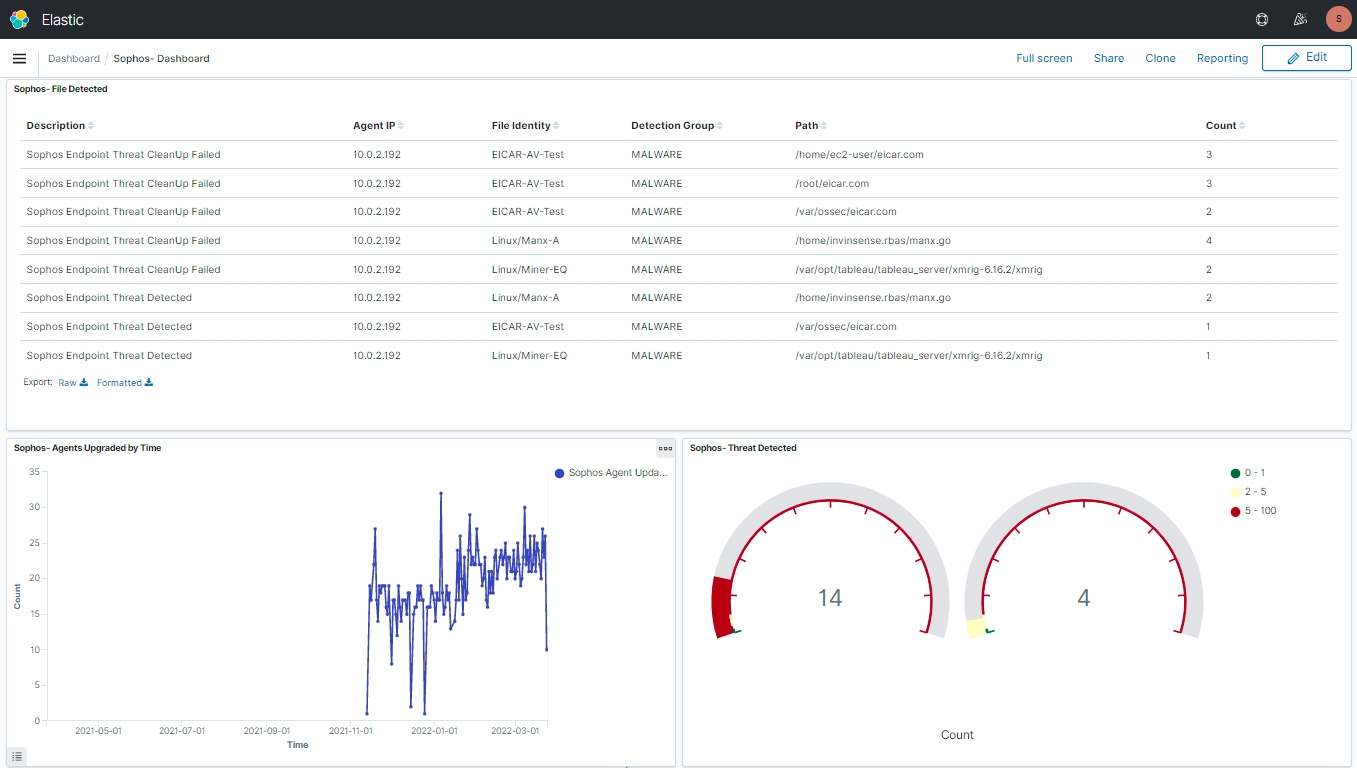
Once the configuration is done the logs will be collected by Wazuh and the alerts will be shown.
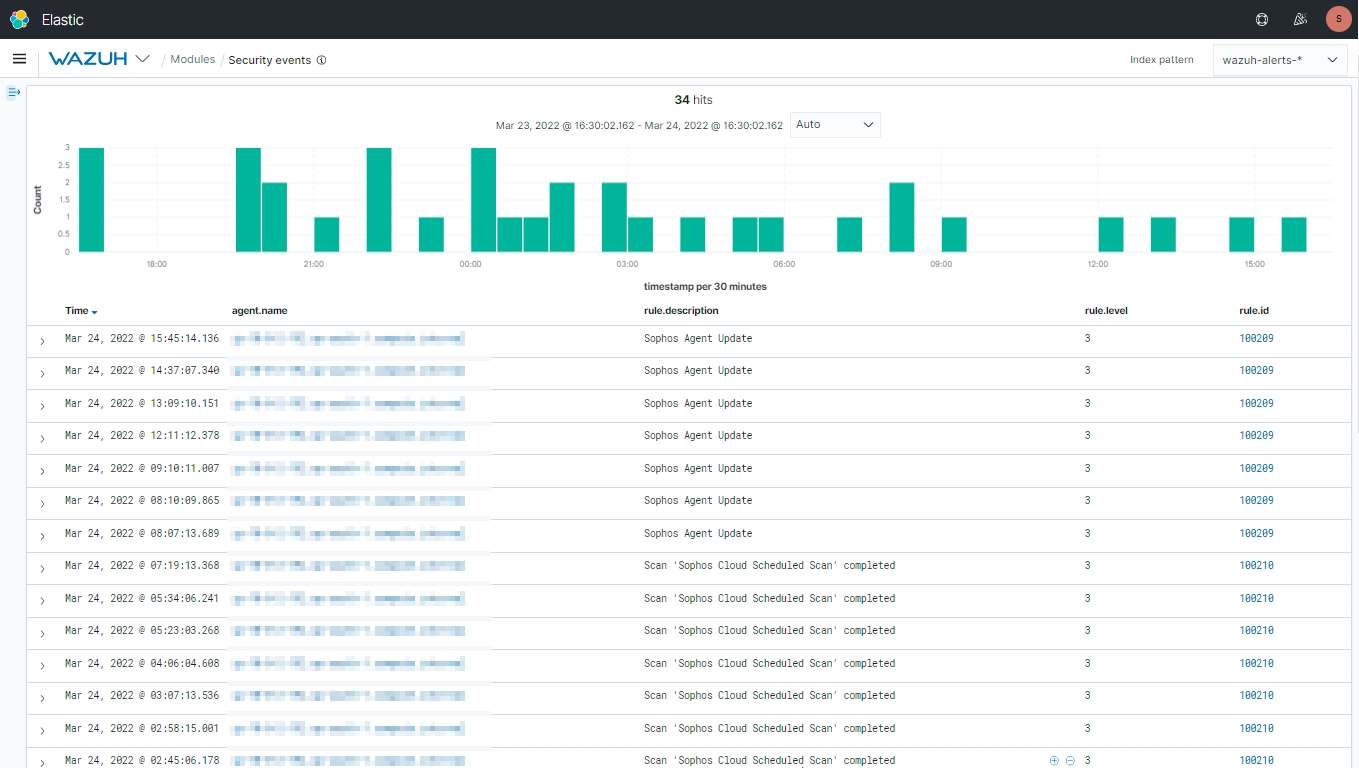
You can create custom Dashboards according to your needs.