Monitoring AWS RDS logs with Wazuh

Monitoring AWS RDS logs with Wazuh


On Monday, October 4, 2021, RDS (Amazon Relational Database Service) allows clients to scale and manage relational databases in the cloud. Amazon RDS API calls made by or on behalf of an AWS account are logged by AWS CloudWatch. After that, the data is saved in an Amazon S3 bucket.

Monitoring is a crucial component of keeping Amazon RDS and your AWS solutions reliable, available, and efficient. If a multi-point failure occurs, you should collect monitoring data from all aspects of your AWS solution so that you can more effectively debug it.

The activity of Amazon RDS DB instances can be monitored by Wazuh using the custom rules and decoders. Wazuh will collect the RDS Logs from the Amazon CloudWatch Logs as configured above.
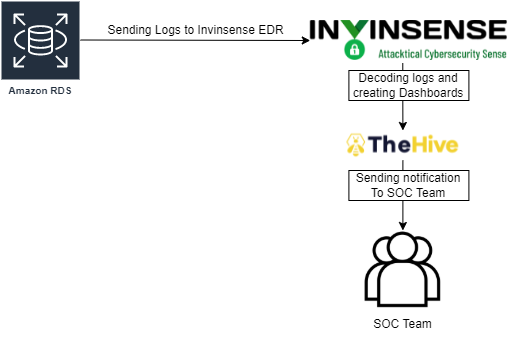
Step-1

AWS RDS Configuration

The logs for the RDS should be exported via the following options so that it can be pushed in the Amazon CloudWatch Logs.
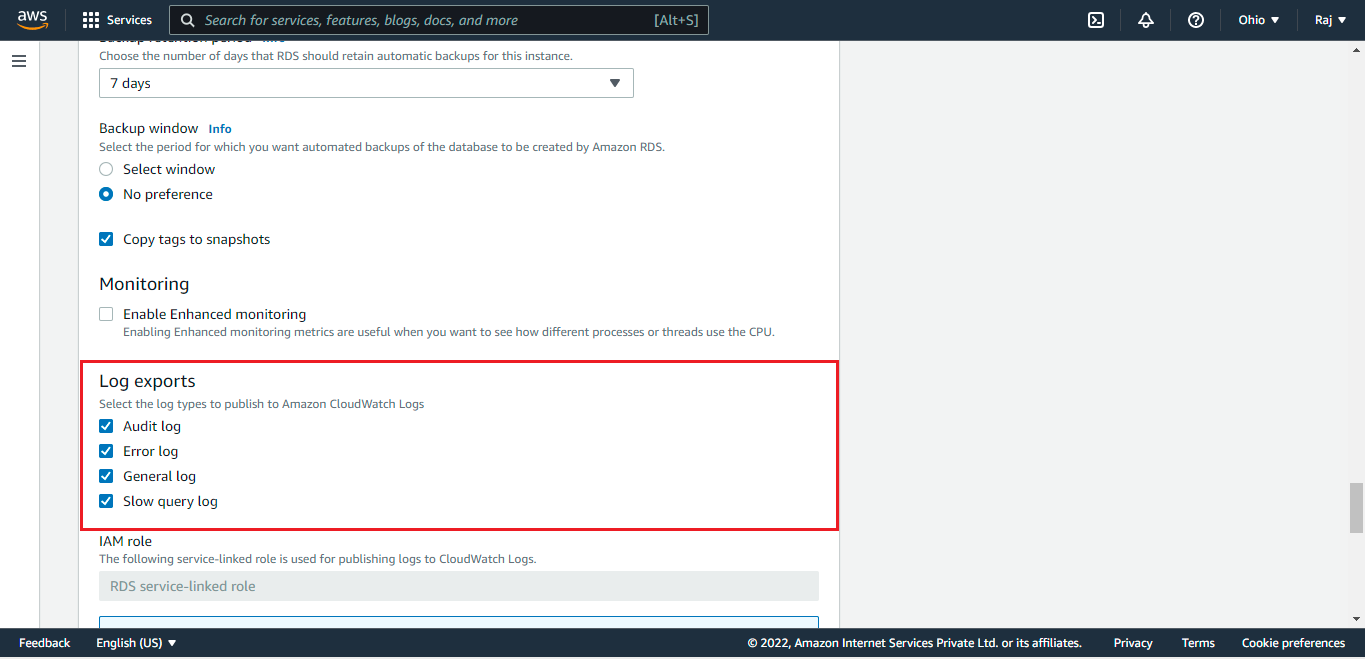
Step-2

Wazuh configuration for AWS RDS

Login to your Invinsense Portal and open Wazuh

Logs from AWS CloudWatch can be accessed by configuring CloudWatch to store them in a bucket or by using the CloudWatch Logs Agent. Wazuh can retrieve those logs, analyse them, and raise alerts if necessary, via the AWS API.

The CloudWatch service needs to be configured for wazuh to monitor the logs from it, add the following configuration block in /var/ossec/etc/ossec.conf file or configure it via the WUI.

<wodle name="aws-s3"> 
    <disabled>no</disabled> 
    <interval>10m</interval> 
    <run_on_start>yes</run_on_start> 
    <skip_on_error>yes</skip_on_error> 
 
    <service type="CloudWatchlogs"> 
      <access_key>``your IAM user access key``</access_key> 
      <secret_key>``your IAM user secret key``</secret_key> 
      <aws_log_groups>/aws/rds/instance/prod/error</aws_log_groups> 
      <regions>ap-south-1</regions> 
      <only_logs_after>2021-NOV-19</only_logs_after> 
      <aws_account_id>``your AWS Account ID``</aws_account_id> 
    </service> 
     
    <service type="CloudWatchlogs"> 
      <access_key>``your IAM user access key``</access_key> 
      <secret_key>``your IAM user secret key``</secret_key> 
      <aws_log_groups>/aws/rds/instance/prod/slowquery</aws_log_groups> 
      <regions>ap-south-1</regions> 
      <only_logs_after>2021-NOV-10</only_logs_after> 
      <aws_account_id>``your AWS Account ID``</aws_account_id> 
    </service> 
     
    <service type="CloudWatchlogs"> 
      <access_key>``your IAM user access key``</access_key> 
      <secret_key>``your IAM user secret key``</secret_key> 
      <aws_log_groups>/aws/rds/instance/prod/audit</aws_log_groups> 
      <regions>ap-south-1</regions> 
      <only_logs_after>2021-NOV-19</only_logs_after> 
      <aws_account_id>``your AWS Account ID``</aws_account_id> 
    </service> 
 
    <service type="CloudWatchlogs"> 
      <access_key>``your IAM user access key``</access_key> 
      <secret_key>``your IAM user secret key``</secret_key> 
      <aws_log_groups>/aws/rds/instance/prod/general</aws_log_groups> 
      <regions>ap-south-1</regions> 
      <only_logs_after>2021-NOV-19</only_logs_after> 
      <aws_account_id>``your AWS Account ID``</aws_account_id> 
    </service> 
  </wodle>

Adding Decoders and Rules in Wazuh

To get the logs from RDS for the User-actions and Errors, we’ll use the below decoders and rules and will place it in local_decoder.xml and local_rules.xml files.

Add the following decoders in the /var/ossec/etc/decoders/local_decoders.xml file or use the WUI

<decoder name="RDS"> 
    <prematch>^\.* Connect|Query|Quit</prematch> 
</decoder> 
 
<decoder name="RDS-1"> 
    <parent>RDS</parent> 
    <regex>(\.*)</regex> 
    <order>Action</order> 
</decoder> 
<decoder name="RDS-1"> 
    <parent>RDS</parent> 
    <regex>(\w+) (\.*)\s</regex> 
    <order>id,user-action</order> 
</decoder> 
<decoder name="RDS-1"> 
    <parent>RDS</parent> 
    <regex offset="after_regex">(\.*)</regex> 
    <order>query</order> 
</decoder> 
 
<decoder name="RDS-1"> 
    <parent>RDS</parent> 
    <regex offset="after_regex">\s(\w+)@(\.*)\son\s(\.*)\susing\s(\.*)</regex> 
    <order>username,srcip,service,protocol</order> 
</decoder> 
 
<decoder name="RDS-ERROR"> 
    <prematch>^\.* Aborted</prematch> 
</decoder> 
 
<decoder name="RDS-2"> 
    <parent>RDS-ERROR</parent> 
    <regex>(\.*) (\.*\s\.*) (\.*) db:\s(\.*) user:\s(\.*) host:\s(\.*) </regex> 
    <order>severity,connection-action,id,db,user,host</order> 
</decoder> 

And add the following rules in the /var/ossec/etc/rules/local_rules.xml file or use the WUI

<group name="RDS"> 
  <rule id="100141" level="3"> 
    <decoded_as>RDS</decoded_as> 
    <field name="user-action">Connect</field> 
    <description>Connect using $(username)</description> 
  </rule> 
</group> 
 
<group name="RDS ERROR"> 
  <rule id="100208" level="3"> 
    <decoded_as>RDS-ERROR</decoded_as> 
    <field name="connection-action">Aborted Connection</field> 
    <description>Aborted Connection from $(dstuser)</description> 
  </rule> 
</group> 

After the changes done in the configuration, the wazuh-manager’s service needs to be restarted.

For Systemd:

systemctl restart wazuh-manager 

For SysV Init:

service wazuh-manager restart 

You can test the RAW logs to confirm if the decoders and rules are properly working or not.
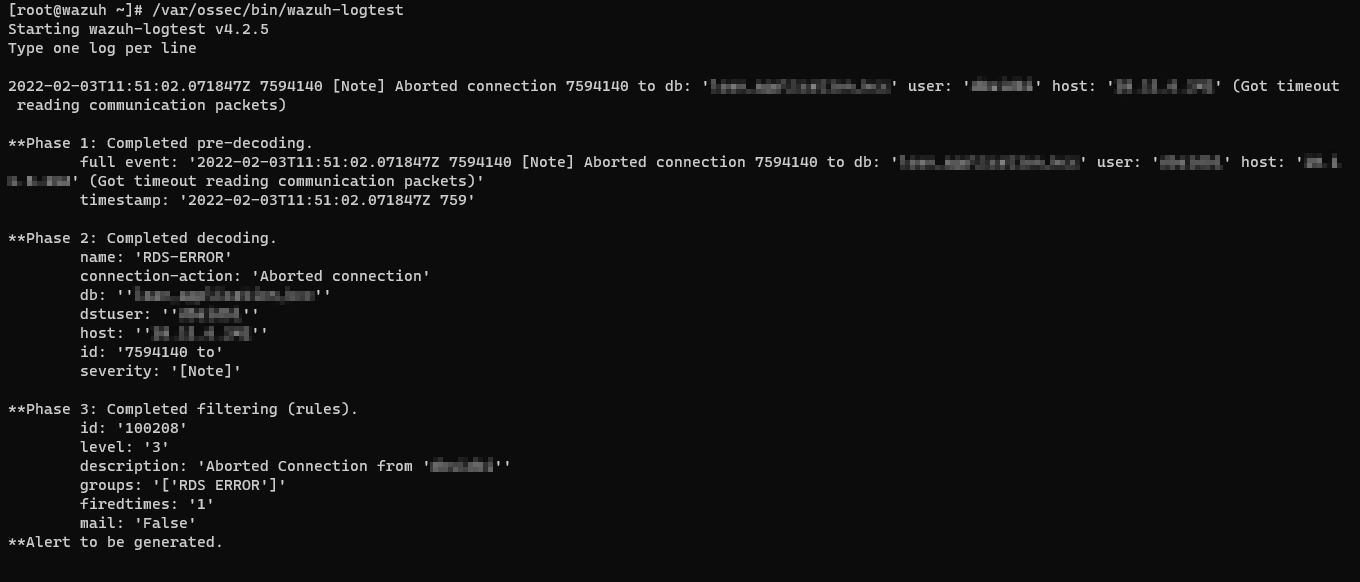
Step-3

Once the configuration is done the logs will be collected by Wazuh and the alerts will be shown.
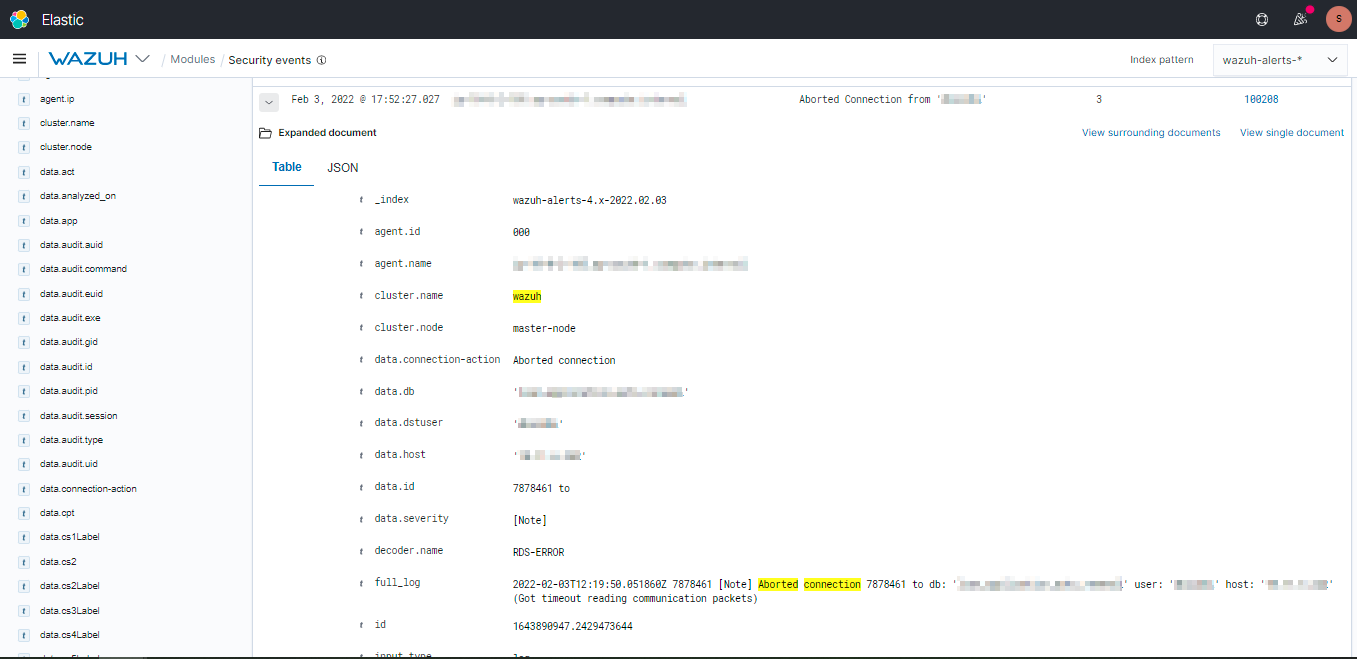
Step-4

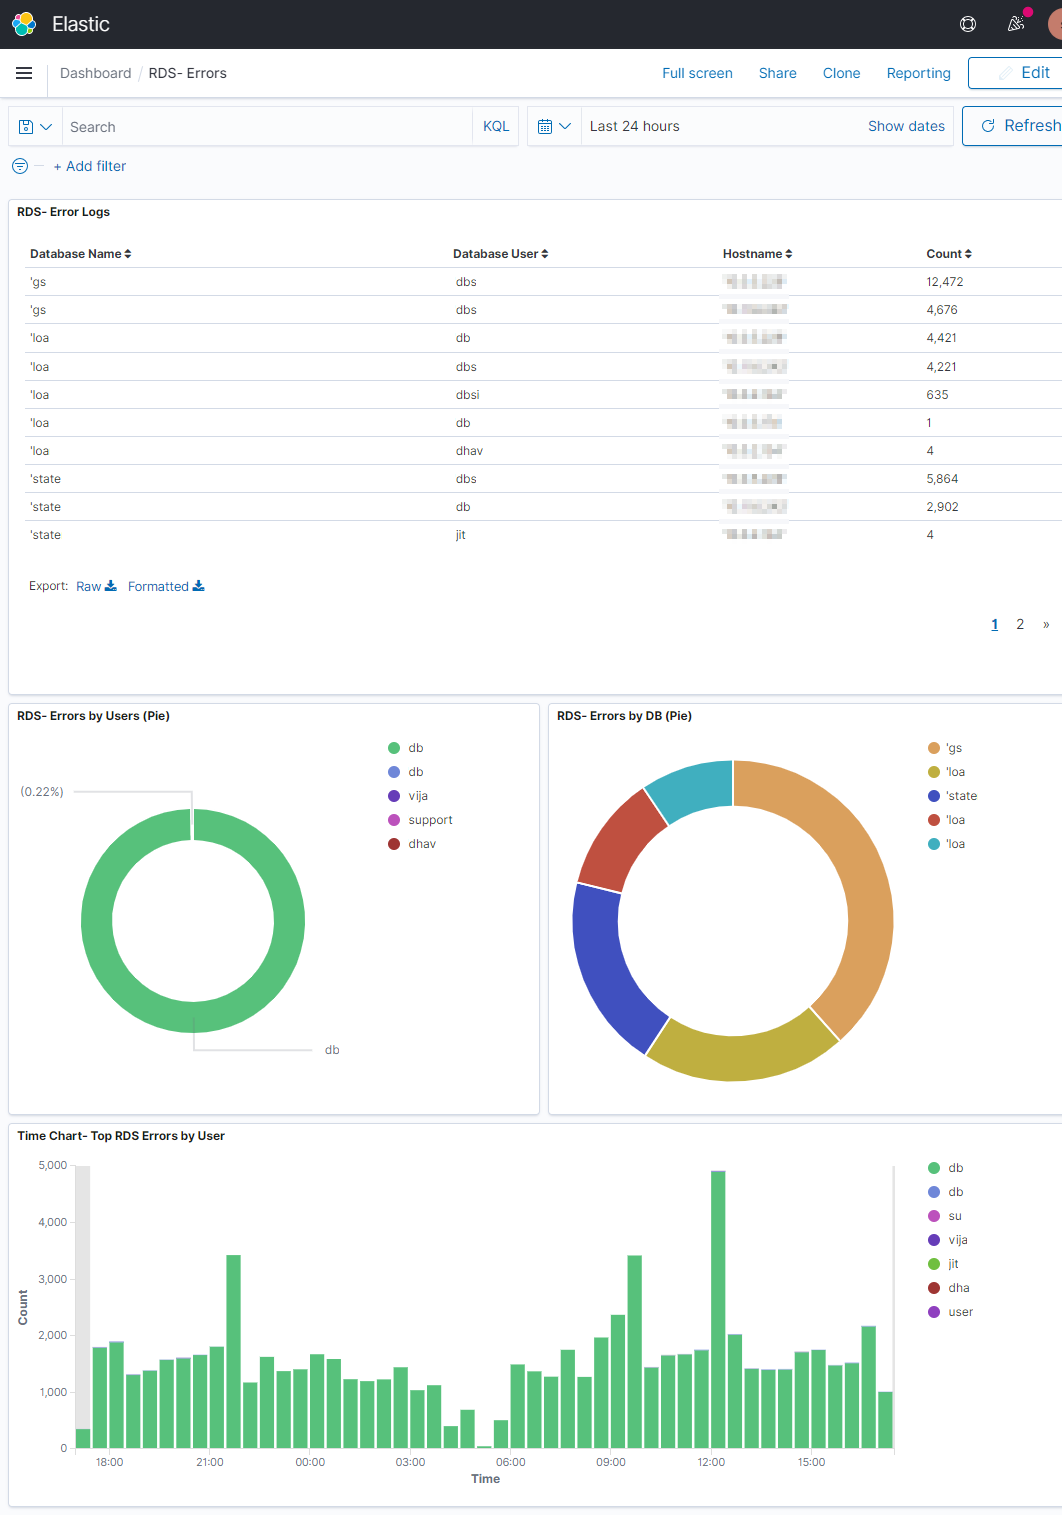
You can create custom Dashboards according to your needs.
Step-5

Conclusion

Using Wazuh and CloudWatch, we can analyze AWS RDS events of high relevance to keep track of everything that happens in your Amazon Relational Database Service. You can do this for Audit logs, General logs and Slow Query logs as well.


Solutions

Solutions

Services

Services