
On Monday,October 4, 2021, The Imperva WAF (Web Application Firewall) is a security solution designed to fight against web application security risks. SQL injection, remote file inclusion, cross-site scripting, and other OWASP Top 10 and Automated Top 20 risks are all protected by it. Imperva security researchers monitor the threat landscape and update WAF as needed.
With Wazuh, we can monitor the Imperva WAF Logs in a single location with many visualizations to make the monitoring and correlation easy. For that we need the custom rules and decoders to let get Wazuh know to trigger alerts if any anomaly is there.
We have syslog server which will be fetchingfetch the Imperva WAF Logs in a single log file and we will then puchbe pushing the Imperva WAF Log files via the Wazuh agent so that it can be analysed and monitored.
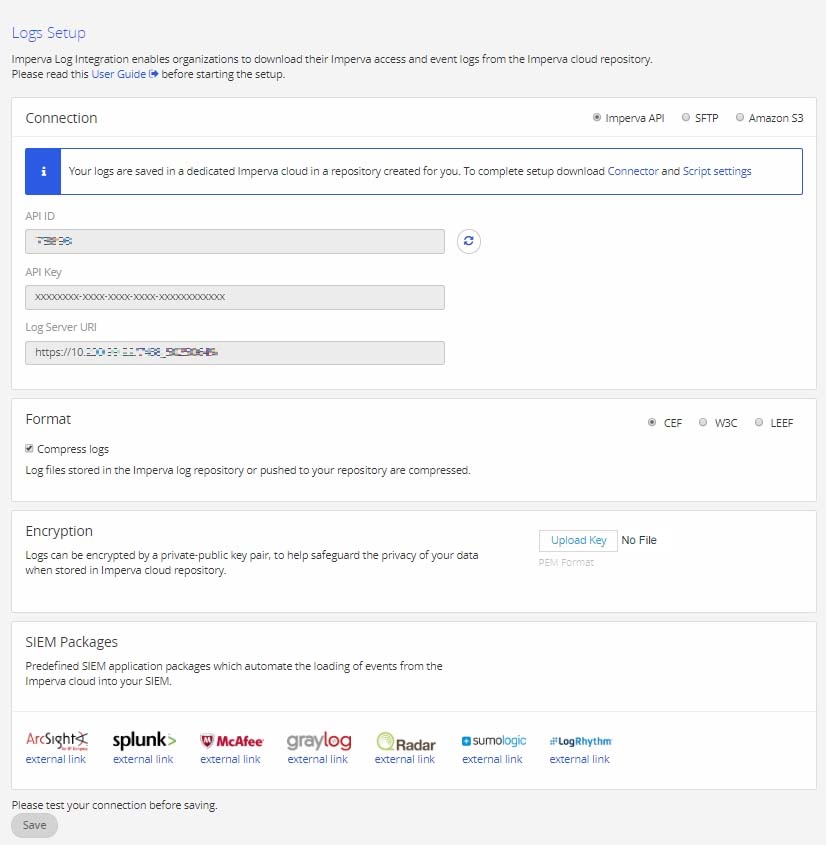
Log into your my.imperva.com account and navigate to the Logs Setup page:
On the top menu bar, click Account > Account Management. On the sidebar, click SIEM Logs > WAF Log Setup.
Pull mode: Download logs using a script
If you choose to manage your logs using the Imperva log integration API, you need to download the logs after they are generated. A sample Python script for implementing the API, referred to as the Connector, as well as installation and configuration instructions, are given below. The script is managed by the open-source community.
A Python script for downloading log files from Imperva CloudWAF
git clone https://github.com/imperva/incapsula-logs-downloader.git
This script requires Python 3
The script has the following jsdependencies that may require additional installation modules, according to the operating system that is used.
A requirements.txt file is included in the script directory, so that the following can be used to install requirements and dependencies:
Create a local folder for holding the script configuration, this will be referred as path_to_config_folder
An example for calling the script is below:
Running The Script as A Service:
You can run the script as a service on Linux systems by using the configuration file - linux_service_configuration/incapsulaLogs.conf
You should modify the following parameters in the configuration file according to your environment:
You can use start/stop/status as any other Linux service
A dockerfile is provided to build your own image locally. At this time, a dockerhub image is not available.
Configuration:
The connector script will look for the following environment variables, and fall back to the configuration file if the environment variable is not set:
Note - In order to use a custom CA file, you will need to either build a docker image with the file embedded, or mount a persistent data volume to the image and provide the full path to the file as this variable value.
Encrypted Logs:
The recommended method would be to mount a persistent data volume at /etc/incapsula/logs/config/keys that contains numbered subfolders with key files as detailed in Preparations for using the script.
You can also use the dockerfile in this repo to build the image with your keys baked in.
This section provides an overview of the process you need to follow to download Imperva logs.
This example shows how to decompress a log file using Linux bash commands:
Format of the logs will be in CEF.
Click Save to save all changes.
On the sidebar, click Log Levels. The following window displays:

Select a log level for each site to enable logging, or leave disabled. There are two levels of logs:
Once the logs are started, we will fetch those from the Syslog server via Wazuh Agent. But there is one catch, Imperva creates a new log file every time and we cannot specify each and every log file in our Wazuh Agent’s Configuration.
So, to resolve this problem we will be using the Incron service. It works similarly in a similar manner as the standard cron service. Filesystem events such as the creation, deletion, or modification of files or directories triggers the Incron jobs. So, in our case an Incron job will be triggered when any new log file is created and it will append all the log files into one.
Install the Incron service:
To configure incron access we have to configure /etc/incron.allow and /etc/incron.deny files.
/etc/incron.allow: If this file exists only users listed here may use incron.
/etc/incron.deny: If this file exists only users NOT listed here may use incron.
If none of these files exist, any user on the system can use incron.
Syntax:
: It is the absolute path to the directory to be monitored.
: It is the event mask, which might be either symbolic or numerical.
Event Symbols (Masks):
IN_ACCESS: File was accessed (read).
IN_ATTRIB: Metadata changed (permissions, timestamps, extended attributes, etc.).
IN_CLOSE_WRITE: File opened for writing was closed.
IN_CLOSE_NOWRITE: File not opened for writing was closed.
IN_CREATE: File/directory created in watched directory.
IN_DELETE: File/directory deleted from watched directory.
IN_DELETE_SELF: Watched file/directory was itself deleted.
IN_MODIFY: File was modified.
IN_MOVE_SELF: Watched file/directory was itself moved.
IN_MOVED_FROM: File moved out of watched directory.
IN_MOVED_TO: File moved into watched directory.
IN_OPEN: File was opened.
: It consists of an executable command, file (or script) and its arguments.
The following wildcards may be used inside the command specification.
$$: Prints a dollar sign
$@: Add the watched filesystem path
$#: Add the event-related file name
$%: Add the event flags (textually)
$&: Add the event flags (numerically)
After the changes done in the configuration, the wazuh-agent’s service needs to be restarted.
For Systemd:
For SysV Init:
We will now add the /var/log/imperva/fail path for monitoring and if any new log file is created, we will set a command to append those log files to /var/log/imperva.log.
Edit the incrontab:
Enter any Suitable mask such as IN_MOVED_TO and your command with wildcards such as $% as per your needs.

Wazuh configuration for Imperva
The new log file is created and we can use this for monitoring.
Open the Wazuh Agent’s configuration:
Add the following block:
After the changes done in the configuration, the wazuh-agent’s service needs to be restartrestarted.
For Systemd:
For SysV Init:
Adding Decoders and Rules in Wazuh
To let Wazuh understand the logs of Imperva WAF and trigger alerts for any anomalies, we’ll use the below decoders and rules and will place it in local_decoder.xml and local_rules.xml files. Add the following decoders in the /var/ossec/etc/decoders/local_decoders.xml file or use the WUI
And add the following rule in the /var/ossec/etc/rules/local_rules.xml file or use the WUI
<rule id="100216" level="4">
<decoded_as>Imperva</decoded_as>
<match>$Imperva_Rule_Name</match>
<description>$(IncapRules) $(sourceServiceName) $(act) </description>
</rule>
After the changes done in the configuration, the wazuh-manager’s service needs to be restarted.
For Systemd:
For SysV Init:
Adding Decoders and Rules in Wazuh
To let Wazuh understand the logs of Imperva WAF and trigger alerts for any anomalies, we’ll use the below decoders and rules and will place it in local_decoder.xml and local_rules.xml files. Add the following decoders in the /var/ossec/etc/decoders/local_decoders.xml file or use the WUI

Once the configuration is done the logs will be collected by Wazuh and the alerts will be shown.
Login to your Invinsense Portal and open Wazuh

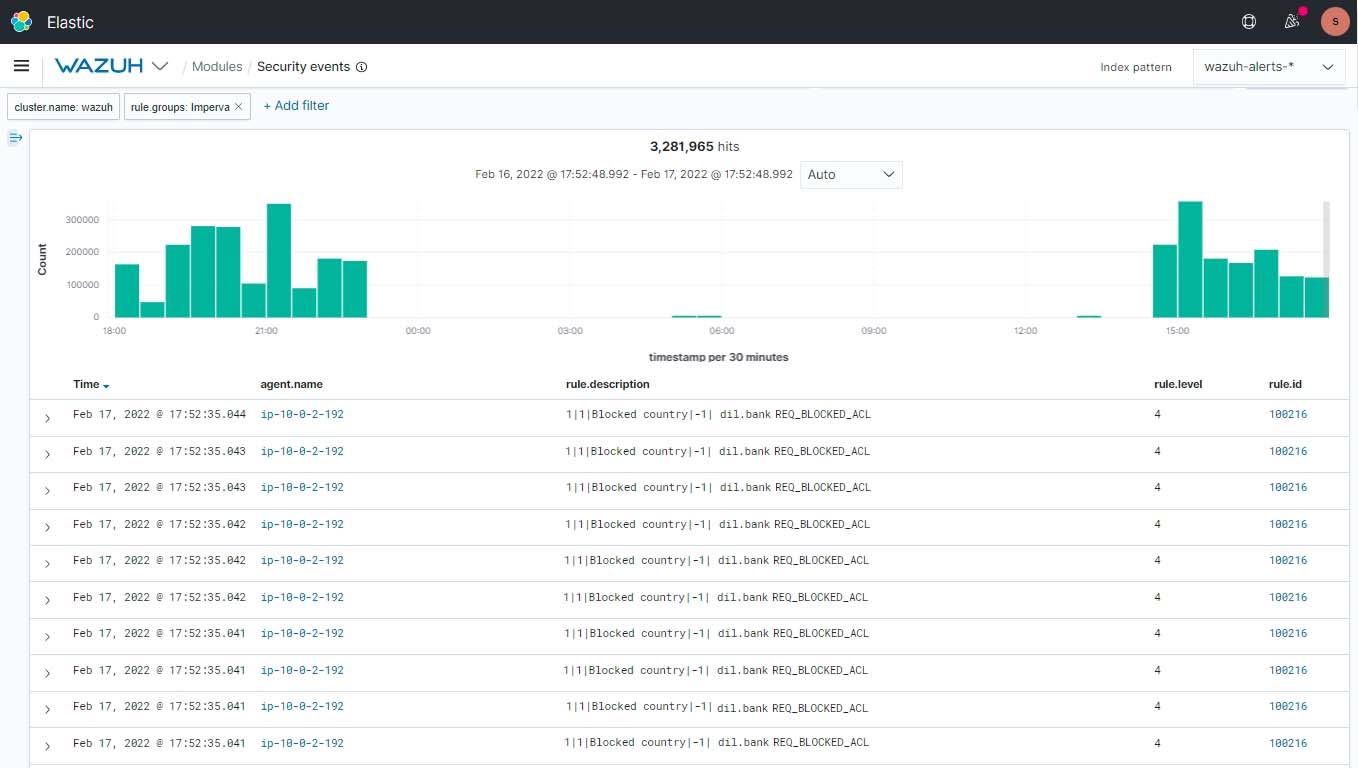
You can create custom Dashboards according to your needs.
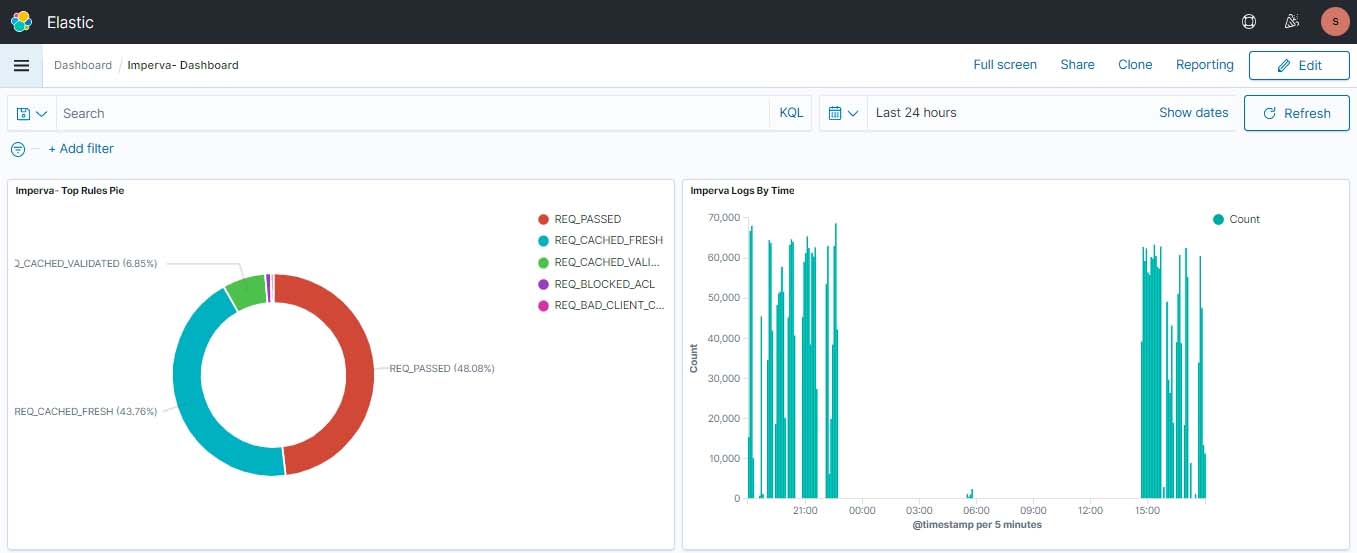
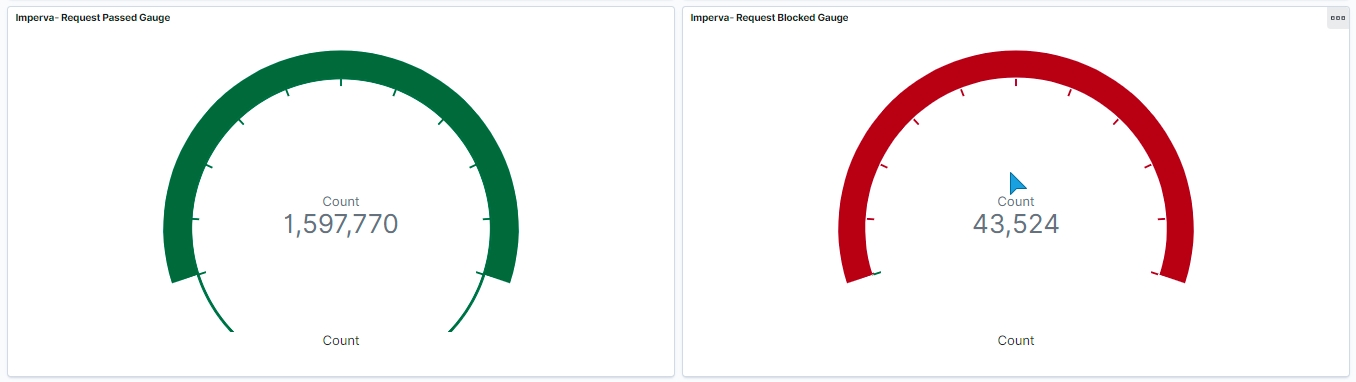

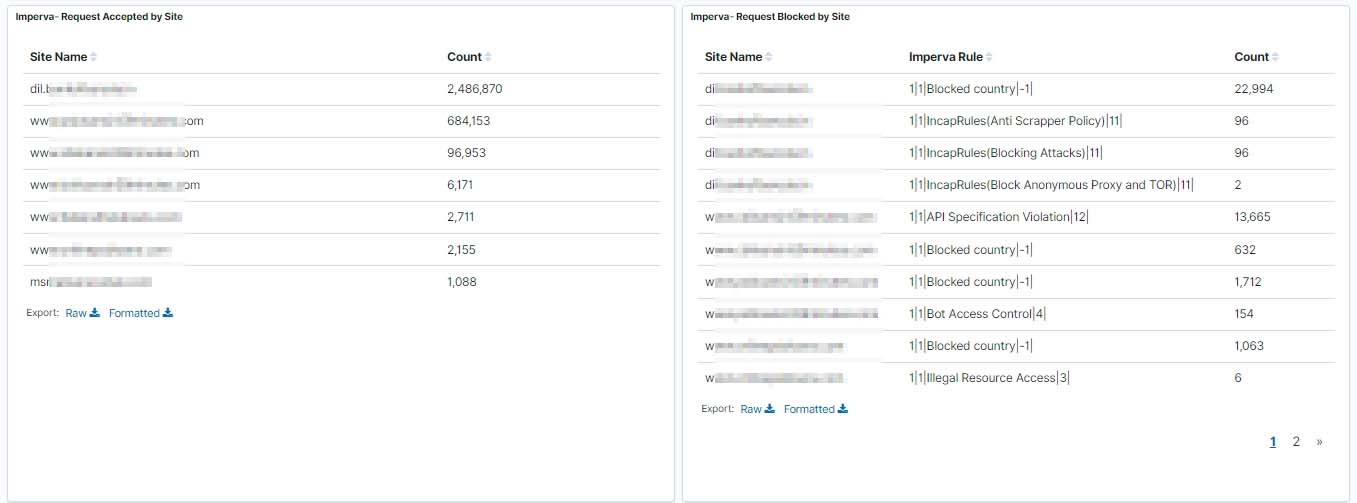
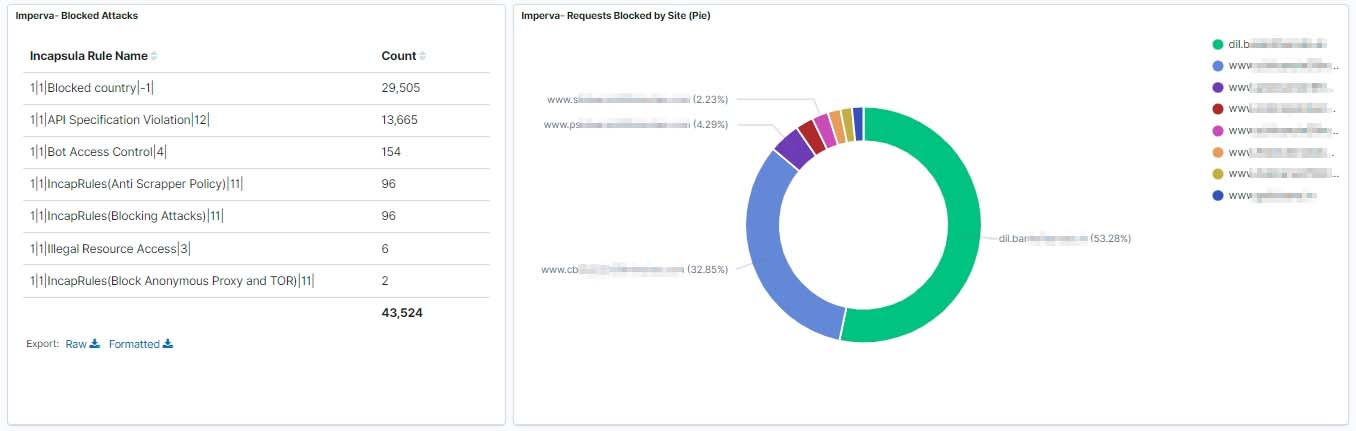
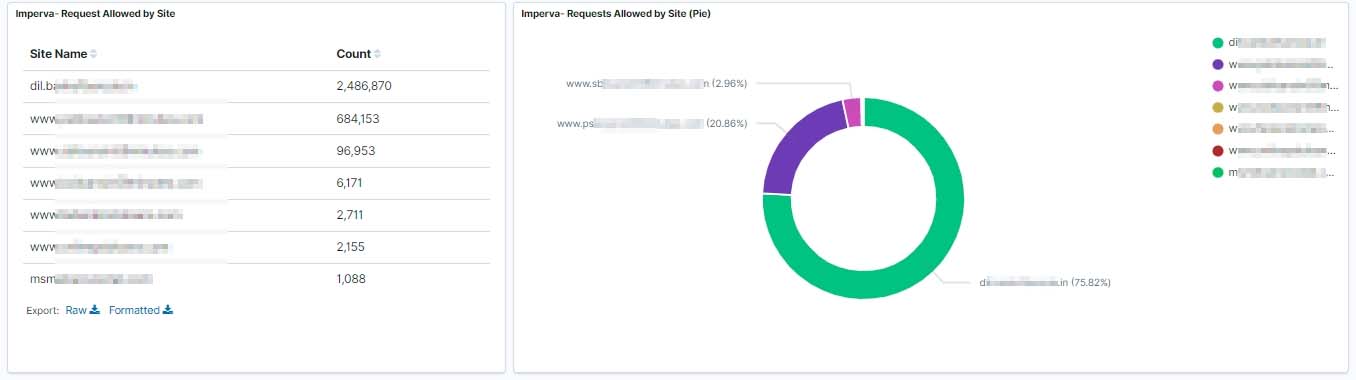
In this article, we have integrated Imperva WAF events, we can analyze Imperva WAF events in Wazuh to keep track of everything that happens in your Web Application and can catch any suspicious activity happening. With multiple visualization and dashboards, we can easily monitor the complex incoming data.
Discover complete cybersecurity expertise you can trust and prove you made the right choice!